Blog Archives
Up 2,500 points this month
The market is back in full swing and we have been rewarded handsomely. In the last 24 hours I have had some nice gains and I am on track to another good month.

Perseverance goes a long way in this business. I started out this month from behind after losing 4 trades in a row and digging myself into a small hole. I continued to execute my plan and manged to make back my losses and then some. I have also brought my batting average back to a respectable level.
The best way to pull yourself out of a losing streak is to have amnesia when you approach new positions. You got to forget about the last trade and how much you made or lost and move on to the next trade. Every trade is different and you do not want your emotions spilling over to the next trade. This allows you to stay focused and execute your plan based on what you see is happening instead of your emotions taking over and dictating what you do.
Risk to Reward
I have been so busy this week that I have not been able to trade my personal account much. But here is an update of where I am at as we approach the middle of the month.
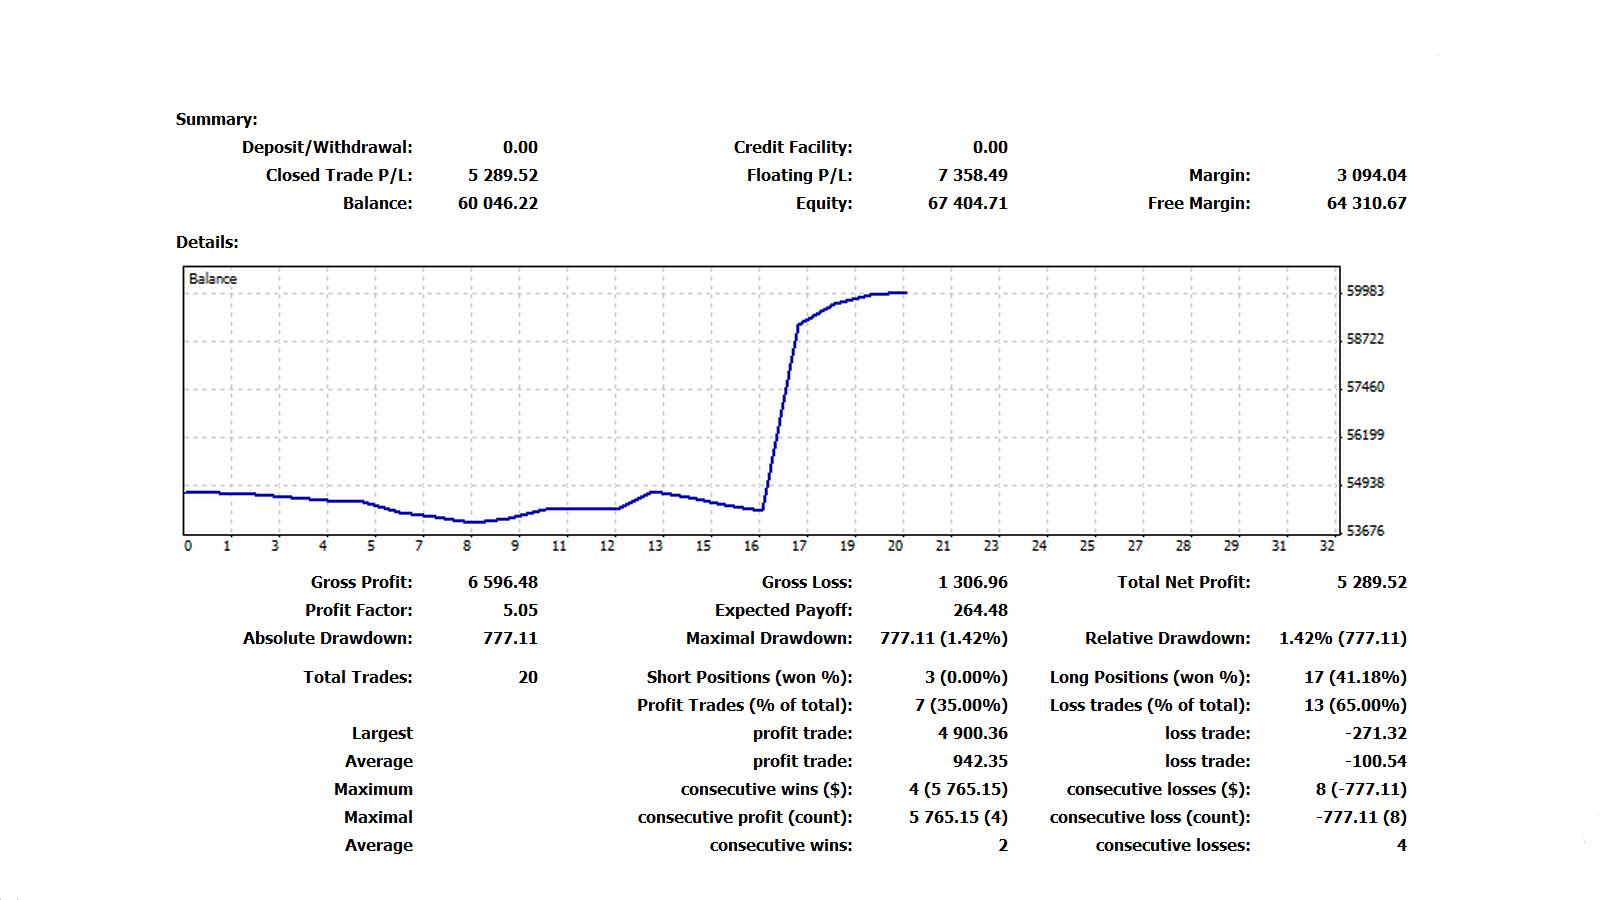
If you notice my batting average has suffered severely because I have not been able to pay as much attention to my positions. But because I maintained a solid risk to reward on each position I have still been able to see consistent results. Stay Tuned!
XAU: Respect is Earned
OMG! it looks like gold just does not want to quit. Looking back at one of my previous newsletters we anticipated a pull back on the daily chart to find an opportunity to add to our position. The chart below is a snap shot of price action on August 22nd when we projected the pull back.

Look at that we got our pull back and follow through on our buy setup. Not only did we got follow through traders but we even got a new high. Now that is what I am talking about!!!

You are probably wondering how I was able to project that price would not only pull back but eventually present another buy opportunity. The move we got from the bulls last week took a lot of buying power to establish. Buying power that could only come from big institutions. When you see big candles or moves that clear a lot of price action on the chart they demand your attention and command respect. On the chart below you can see how I have highlighted the powerful moves established by the bulls in side the grey areas and the buy zones that have been established based on these moves by the bulls inside the blue rectangle areas. A Buy Zone is the area from the prior low of a bullish candle or bullish move to the prior high. We typically look for pull backs to the 33% – 61.8% level inside the Buy Zone. (The same applies in reverse for a sell zone created by a move from the bears.)

Now that we understand how to identify a Buy and Sell zone, your probably asking yourself how to incorporate these zones in your trading. It is easier than you think. First you must make sure that your Buy Zone is inline with your higher time frames. If it is counter to your higher time frames then you want to make sure that there is enough upside potential to your next area of resistance. In other words you want to make sure your risk to reward is on point. Now inside a Buy Zone you will see all kind of attempts from the bears to wipe out what the bulls have established. But it is your job not to be fooled by these moves, instead you want to be patient and wait for a buy opportunity to present itself inside the Buy Zone. This can be applied to any time frame but keep in mind that the higher time frames are always going to carry more weight than the smaller ones. So that means that Buy Zones on the higher time frames are always going to be stronger than zones created on smaller time frames. Now Rule number 2 is a Buy Zone is still valid until it is wiped out from the bears completely. If you follow these few rules and respect these Zones by trading with them your trading profits will soar.
GBP/USD Buy Setup
Ok traders we got what we were looking for on GBP/USD. Notice how price action reacted timidly towards the 200 MA and gave us a higher low as it bounced off of the support area at the 200 MA. Then had the strength to close back above the 8 MA OMG!. The buy setup on the daily is starting to show some follow through which is a good sign for our long position.
I have entered the market with my stop in 2 different areas. But if you are just now looking to enter this trade I would place my stop-loss under the previous candle. So our entry point would be at 1.58273, our stop-loss at 1.57415 and our initial target at the prior high on the daily. Stay Tuned!

S&P 500 Trade Update (The Bottoming Tail)
Do you see what I see! Things just keep getting better and better for S&P 500. I mean are you kidding me a Bottoming Tail some call it the Hammer others call it the hanging man but regardless what you choose to call it, it is the second most bullish candle in our Candle Stick Alphabet, sitting right on top of the 20 MA. Need I say more traders, we are getting blatant strength from the bulls. A bottoming tail is formed when the bears start out dominant and are able to push price down to a lower level. But before the candle closes the bulls are able to overcome the bears strength and close out the candle as the side that won the battle. If you look at the chart below you will notice how in the past four weeks every time the bears attempt to muster up some strength, before the week is out the bulls have wiped out what the bears have tried to establish and then some establishing themselves as the side that is in control. In a lot of cases doing so in less time then the bears had to establish their strength, talk about power. This is why the Bottoming Tail is one of the most powerful tools inside our Traders Toolbox that we have at our disposal.

If you notice in the chart below we are starting to get some follow through to the upside as a result of the Bottoming Tail from last week. By spotting the right candles on the right time frames you are able take advantage of certain moves and opportunities as they present themselves with the confidence of knowing you are trading in the direction of least resistance.

$&P 500 Trade Update were in the money!
Man what can I say S&P 500 has been a beast. I mean did we pick the right time to go all in or what. Our Long position and add has paid us handsomely. As stated earlier we were looking to take profit at the top of the channel as price makes its way into the prior high. We are up 600 points and counting and we still got some nice size on this position. I am looking to get light on my position at the prior high on the monthly. It is rare in trading to have a home run but I think it is safe to say we knocked this one out of the park. Stay Tuned!


On another note have you ever heard the saying strike while the irons hot, get to gettin while the gettin is good, ride the trend till the end, Milk it dry etc… Although it is best to ride the trend as long as you possibly can during any season in the markets. During the summer since good trades and solid trends are far and few between (except this week in the market oh boy) one has to try to take advantage of any trend you find and follow the money. That means ride the wave and add till you cannot add no more. Now of course you want to keep your risk in check, treat every trade separately even if they are on the same chart, and follow your trading plan. But if there is money staring you in the face on a particular pair or commodity then stick with that pair or commodity because if it is paying and the other pairs or charts are choppy then the instrument that is paying is the one that commands our attention. As you can see in the chart above I have played S&P in a major way as well as AUD this past month because these are the charts that commanded my attention. In directing my focus to these charts I was able to avoid the whip saw and choppiness in other pairs that would have more than likely resulted in me giving some profit back.
A body in motion tends to stay in motion
Newton’s first law of motion is often stated as, An object at rest stays at rest and an object in motion stays in motion with the same speed and in the same direction unless acted upon by an unbalanced force.
So in our case it is safe to say that a candle in motion will tend to stay in motion in the same direction, unless compelled to change that state by external forces acted upon it. To explain this matter in further detail. If we have had a bullish month on the monthly chart where the momentum on the previous or current candle is with the bulls then there is a great probability that the next candle on the monthly chart will be a bullish candle. If we have had a bullish week on the weekly chart where the momentum on the previous or current candle is with the bulls then there is a great probability that the next candle on the weekly chart will be a bullish candle. And if we have had a bullish day on the daily chart where the momentum on the previous or current candle is with the bulls then there is a great probability that the next candle on the daily chart will be a bullish candle. I think you get the point.
AUD has been the big boy on the block. It has been very bullish for the last 2 months and has been out preforming the other currency pairs. Looking at the Monthly AUD/USD chart below you can see I have an arrow pointed at last months candle. Notice how last months candle wiped out 80% of Mays candle. Based on where last months candle closed we can see how the momentum has shifted in the bulls favor. As this months candle comes to a close and sets us up for a potential buy setup it looks like unless something drastic happens price action will follow through and continue the momentum from last months candle in the direction of our long bias. Although we have a much higher long term target for this pair, our next target is at the prior high on the monthly. Now there are other aspects to this strategy that must be implemented in order to have success using newtons law in the markets, but when you have mastered this strategy you will find it a lot easier to develop a directional bias and stick to it.

If you fail to plan you plan to fail.
Traders it is here the time we all dread as traders. THE SUMMER!
Every year at the end of June I hit the road and travel because during the summer you will find that there is a lot more consolidation and choppy price action due to there being low liquidity in the markets.
In past years I would find myself trying to force things during the summer only to find myself in a deeper hole. I was under the impression that not even summer could stop me. It wasn’t until I gained time in the chair that I realized you cannot work harder or force progress to get more performance out of your strategy.
If you try to work harder and force things you just fail more and dig yourself a deeper hole.
In order to get more performance out of your strategy you must follow your trading plan. You must be rigid in your rules but flexible in your expectations.
And being flexible in our expectations means making the necessary adjustments as the season or the sentiment changes in the market.
In prior newsletters I touched on the four key areas that a trader needs to master in order to become what is referred to as a Master Trader. But in this newsletter I want to shine a little more light on an area that is over looked by so many traders. DISCIPLINE, so many traders trade with no clear plan or set of rules. Unfortunately how can one be disciplined if you have no clear plan or set of rules to follow.
A Trading Plan is like a road map. When you are on a road trip the road map allows you to know if you are progressing along on your journey or if you have veered off of the path at some point.
If you have not drafted a Trading Plan then I recommend that you should not take another trade in a live account until you have drafted a trading plan that addresses when you are to enter and exit the market, your risk management & money management etc……
The point I am trying to make here is if you have no clear map you will not know if you are progressing along as planned in your journey to becoming a profitable trader or if you have veered of the path.
Have you veered off of your path are you finding you are having inconsistent results in your trading. Then ask yourself two questions. Do I have a trading plan? If you answered yes then ask yourself the next question am I being DISCIPLINED and following my trading plan.
Now on to the fun stuff. Below is the S&P 500 weekly chart. For the second week in a row the S&P 500 has made me proud. For most traders their emotions would have shaken them out of this trade, since price action came within a few points of our stop-loss. But if you held on and implemented some discipline and stuck to your guns you would have been rewarded as price action came back into the bulls favor and closed out last week with a bottoming tail. This presents us with the opportunity to go long or add to our position above the 1369.05 level. Stay Tuned!!!

S&P 500 Trade Update
It looks like we are starting to get some follow through on our weekly buy setup on S&P 500. So I have added to my long position at 1369.45. I expect to see price action rally to 1414.00 with little resistance if this weeks candle can maintain itself above the weekly 20MA. The monthly chart is is also looking promising as it is inline with our weekly chart which provides further confirmation that we could get follow through to the prior high. I have my first Take Profit Level at 1413.75, at that point I will then be watching price action to see if it can break through the prior high at the 1414 level. If price fails to break the prior high then I will adjust my exit strategy accordingly. Stay Tuned!!!

You cannot have your cake and eat it too
Happy Birthday to me! Happy Birthday to me! Yesterday was my 28th Birthday. I spent time with friends and family, had a blast and I enjoyed a tasty Birthday cake. I love cake but this cake in particular was one where I couldn’t decide if I wanted to keep the cake and savor it, or just eat it. I was in a dilemma, I wanted to enjoy the cake and eat it but if I ate the cake it would be gone forever. Although it was tough I made the decision to eat the cake so that not only I could enjoy it but my loved ones could enjoy it too. This situation reminds me of the dilemma we face as traders on a day-to-day, often traders want to have their cake and eat it too. We want the luxury of profiting from our trading activities without the potential for loss. unfortunately we cannot have both.
To break things down a little further in trading there is enormous upside potential to make profits, but on the flip side there are the losses. The losses are apart of trading, they come with the territory and are the cost of doing business. To often traders try to avoid losses when they should be trying to keep their losses to a minimum instead of trying to avoid them entirely.
Trading is a numbers game and there is a random distribution between wins and losses. You could have 8 winning trades in a row and then the next 2 could be losers or you could have 4 losing trades in a row and the next 6 could be winners. Anything can happen. But you don’t need to know what is going to happen next in order to make money. The point I am trying to make here is you have to put yourself in the best position to succeed in trading and you do that by following your trading plan and taking every trade that fits within your trading plan. You got to be rigid in your rules and flexible in your expectations. Remember you are not working in your best interest if you are being selective with your trades in an attempt to avoid a loss. If the trade fits within your trading plan then have no fear and no emotion and pull the trigger. Because you never know, the last trade you avoided could have been the trade that made back the profit you just loss on the last 4 trades.
Now on another note I wanted to share with you my trading pick for the week. I really like what I see on S&P:500. S&P is looking very bullish coming off of a very strong month from the bulls closing above the 20 MA on the monthly chart leaving us with a bottoming tail. Now if you look below at the weekly chart you will see that we have gotten 2 Bull 180’s and a Bottoming Tail with price action finally making its way above the 20 MA on the weekly. This presents us with long opportunities above 1369.45 if price action can sustain itself above the weekly 20 MA. Are long-term target for this trade is at 1413.75. If you are trading on smaller time frames which most of you are I suggest that you set your target according to the risk to reward that fits within your trading plan.
