Blog Archives
“TRICK OR TREAT”
It is here the time of the year where fear is in the air “Mwahahahaahhaha”. So many little boys and girls fear this holiday in-particular because of the goons, goblins, monsters and ghost. Now as kids we might have feared a few of these creatures but as an adult we come to the realization that outside of our imagination, none of these creatures actually exist.
What is fear?
Fear is:
False
Expectations
Appearing
Real.
“Fear” – is defined in the dictionary as:
“…an unpleasant, often strong emotion caused by anticipation or awareness of danger…implies anxiety and usually the loss of courage.”
Now lets look at fear as it applies to traders in the market. All to often traders find themselves acting on emotion and impulse based off of the fear of losing money or being wrong, which in most cases results in a loss anyway when trading against your plan. Trading the markets can be a daunting task for the novice trader.
The fear of loss can keep a trader from executing a trade. Or it can keep him from exiting a trade when his trading plan calls for it. Either can be costly. No one likes to have losses, but even the very best traders do. The key is to realize that you are worrying about the results of “that” trade, and not concentrating on executing your plan, which over time will make you successful.
In closing, “successful” market traders profit off the “fears” of the majority of other traders. How you might ask? They do this by “sticking to their plan” and not allowing their emotions (fears) to rule their decision making ability. Fear can be conquered when you have a plan that you have built confidence in. As you gain time in the chair, confidence builds, and the plan will become easier and easier to follow. Stick with your plan and you will soon see that there is nothing to fear but fear itself.
We talked about the trick now onto the treat. I am pretty sure you have all seen gold lately. If we look at the weekly chart for gold it is looking beautiful. We were expecting a pull back after price got extended away from the MA’s, and we got it. Now price action looks like it might be presenting a buy setup on the weekly. We have already established a long-term Bullish bias for this commodity as we are inside a nice buy zone and inline with our bias on the monthly chart. If you do not trade the higher time frames you can go to your time-frame and find a good entry and stop-loss. If the trade triggers, like my last article touched on “just set it and forget it”.

Happy Halloween Traders.
Up 2,500 points this month
The market is back in full swing and we have been rewarded handsomely. In the last 24 hours I have had some nice gains and I am on track to another good month.

Perseverance goes a long way in this business. I started out this month from behind after losing 4 trades in a row and digging myself into a small hole. I continued to execute my plan and manged to make back my losses and then some. I have also brought my batting average back to a respectable level.
The best way to pull yourself out of a losing streak is to have amnesia when you approach new positions. You got to forget about the last trade and how much you made or lost and move on to the next trade. Every trade is different and you do not want your emotions spilling over to the next trade. This allows you to stay focused and execute your plan based on what you see is happening instead of your emotions taking over and dictating what you do.
Risk to Reward
I have been so busy this week that I have not been able to trade my personal account much. But here is an update of where I am at as we approach the middle of the month.
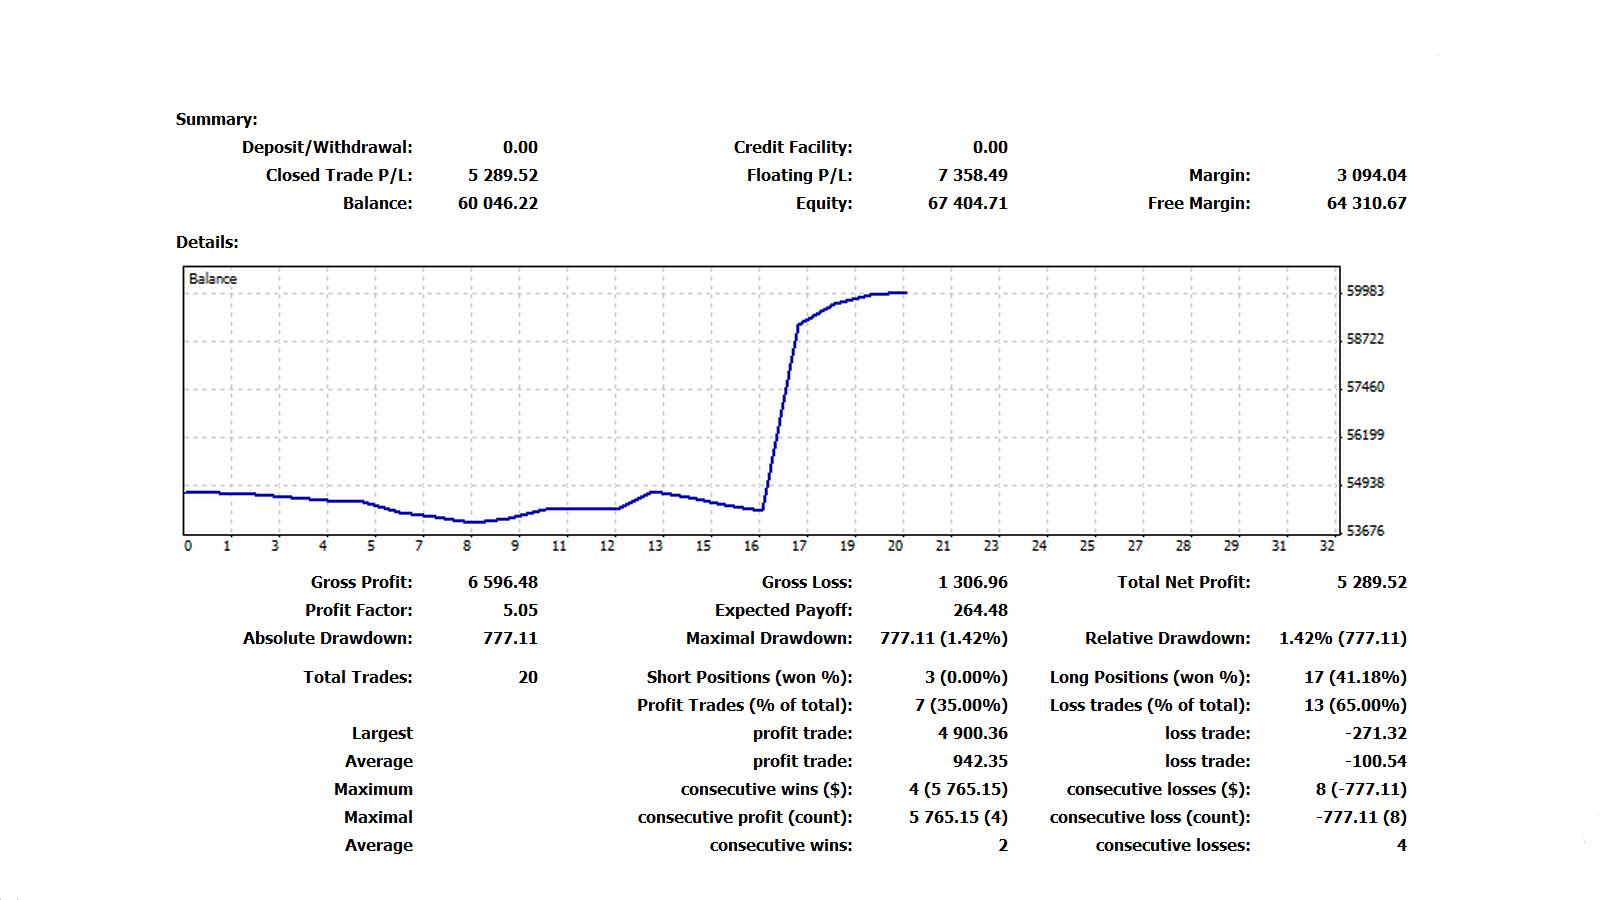
If you notice my batting average has suffered severely because I have not been able to pay as much attention to my positions. But because I maintained a solid risk to reward on each position I have still been able to see consistent results. Stay Tuned!
XAU: Respect is Earned
OMG! it looks like gold just does not want to quit. Looking back at one of my previous newsletters we anticipated a pull back on the daily chart to find an opportunity to add to our position. The chart below is a snap shot of price action on August 22nd when we projected the pull back.

Look at that we got our pull back and follow through on our buy setup. Not only did we got follow through traders but we even got a new high. Now that is what I am talking about!!!

You are probably wondering how I was able to project that price would not only pull back but eventually present another buy opportunity. The move we got from the bulls last week took a lot of buying power to establish. Buying power that could only come from big institutions. When you see big candles or moves that clear a lot of price action on the chart they demand your attention and command respect. On the chart below you can see how I have highlighted the powerful moves established by the bulls in side the grey areas and the buy zones that have been established based on these moves by the bulls inside the blue rectangle areas. A Buy Zone is the area from the prior low of a bullish candle or bullish move to the prior high. We typically look for pull backs to the 33% – 61.8% level inside the Buy Zone. (The same applies in reverse for a sell zone created by a move from the bears.)

Now that we understand how to identify a Buy and Sell zone, your probably asking yourself how to incorporate these zones in your trading. It is easier than you think. First you must make sure that your Buy Zone is inline with your higher time frames. If it is counter to your higher time frames then you want to make sure that there is enough upside potential to your next area of resistance. In other words you want to make sure your risk to reward is on point. Now inside a Buy Zone you will see all kind of attempts from the bears to wipe out what the bulls have established. But it is your job not to be fooled by these moves, instead you want to be patient and wait for a buy opportunity to present itself inside the Buy Zone. This can be applied to any time frame but keep in mind that the higher time frames are always going to carry more weight than the smaller ones. So that means that Buy Zones on the higher time frames are always going to be stronger than zones created on smaller time frames. Now Rule number 2 is a Buy Zone is still valid until it is wiped out from the bears completely. If you follow these few rules and respect these Zones by trading with them your trading profits will soar.
Knowledge is power but applied knowledge is more powerful
Gold did explode, did you get some?
I sure hope you did because this thing has got a lot more upside potential. The monthly is triggering now as we speak and the weekly followed through on our bottoming tail from last week. I know your thinking to yourself does he have a trading crystal ball predicting these moves? The answer is yes and it can be yours for the low price of just kidding with you lol!
But with hard work, back testing, the proper money management & risk management one can become successful in the markets. But the question some traders have to ask themselves is am I applying what I know, am I executing when I am supposed to. A lot traders find themselves stuck like a dear in the head lights when it comes time to execute. And other traders throw their strategy or even their whole trading plan out the window during the heat of the moment and start trading on the fly.
It is important that you are disciplined but it is equally important that you apply what you have learned and pull the trigger when your plan calls for you to without hesitation, reservation, or fear.
Now Looking at the charts below we can see gold is gaining some momentum. So for my swing traders you can take the monthly or weekly as is with your stop below the last pivot on the weekly. But for my intraday traders and my day traders you might want to wait for a pull back on the daily as we are a bit vertical and due for a pull back. Oh I cannot forget about silver she is a beast as well. Stay tuned there is much more bullishness to come from both metals.


Bullish XAU: RingGOLD Hmm! I think my mother was on to something!!!

I am big trader of gold and a lot of other commodities mainly because of my political beliefs and knowledge on the banking system and the fiat currency that is used as a medium of exchange around the world. Another obvious reason is that it is apart of my family name. As I stated in previous Newsletters whenever I have an opportunity to go long Gold, Silver or Oil etc.. I hop on the opportunity as I believe long positions are inline with my long-term bias of gold reaching all time highs as it is a necessity in today’s society, and as central banks continue to print more and more money the result is higher gold prices in the long run. With all that being said it is obvious that price has been consolidating in an ascending triangle on our Daily gold chart. The weekly chart is very promising as we have had several bottoming tails that have formed since the beginning of May. Now we are officially above the weekly 20ma and our bias has shifted to the upside on the weekly chart. With the monthly inline with our long bias and coming off of a bottoming tail that bounced off of a rising 20ma last month. OMG look out Gold is set to explode to the upside. You heard it hear and from me and my fellow colleague Jonathan Velez first GOLD IS SET TO EXPLODE so strap on your seat belts and get ready for the ride. Stay Tuned!!!


Gold Finger is back in love again
Gold is a commodity that has great potential to go higher in the near future along with the rest of the other commodities due to their necessity in our everyday lives. My belief is as things get worse economically around the world more and more countries will start abandoning the $ as the worlds reserve currency, by reducing their holding in US securities and increasing their holdings in commodities like Gold. For some countries this has already become a reality. This presents an opportunity for the day to day trader to take advantage of any moves to the upside that may present themselves in commodities like Gold & Silver. Although I take trades on both the long and short side, as the world goes through the financial crisis that now has now become commonplace. I have given extra attention to bullish signs that present themselves in the Futures Market.
Notice the Higher low on this monthly Gold chart. Price action has started to show bullish signs this month after failing on the three separate occasions to break the higher low that has been formed at the $1530 level. I have long term targets at the prior high at around $1900 but price has to clear the monthly 8 MA.

With the weekly Gold chart below we can see how we got 3 Bottoming Tails after price bounced off of the same level where we recently got a Triple Bottom( you might have to click on the picture to get a clear picture of the candle formations I am referring to). These candlestick formations are all very strong bullish reversal signs and the fact that we got all these reversal signs on the weekly chart gives them even more significance which means we should pay even closer attention to this commodity along with Silver. If price clears the weekly 20 at around $1656 we will have wiped out all of last months price action and should have no problem reaching the prior high on the monthly at $1900.

Notice the strength the bulls have shown on this daily Gold chart. The last candle that we got on the daily chart is one of the bullish candles we have seen in a while from the bulls. This candle indicates that the bulls might be ready to take over and flex their muscles for a while in an attempt to reverse the current trend.
Gold Finger (Update on Gold Trade.)
Since we are trading counter to the current trend my Trading Plan says that I must adjust my stop loss after TP1 has been hit. Now that we have officially hit TP1 for a gain of 14 points, without hesitation or reservation I have adjusted my stop loss to break even.
Discipline goes a long way in this business. Having a plan and executing it to a T is critical to your success as a trader. Do you have a Trading Plan? Trading without one is like going on a road trip with no map and no intended destination. Do you know where you are headed and do you know what to do when you get there. All to often traders will hop in a trade with no clue on how much they are risking and where they plan to get out of the market should there bias turn out correct. I cannot stress enough the importance of having a solid trading plan that addresses when you are to enter the market and exit the market.
Gold Finger “I LOOOOOOVE GOLD!!!”
Below is a daily chart of the XAU/USD and the first thing that stands out should be the follow through after the bottoming tail formation that brought price comfortably above the 8 MA. Now it is clear that the current trend is bearish, but with price action as oversold as its been we have been overdue for price to pullback and give us a correction. After a forceful move from the bulls we see that for the time being the momentum has shifted from the Bears to the Bulls. And as Newtons Law says things in motion tend to stay in motion. So with that being said we could expect to see a continued move to the $1602.89 area to complete the correction to the 20MA. If executed properly this trade presents a great risk to reward opportunity with a chance to net 27 points while only risking 8 points.

