Blog Archives
Work Smarter Not Harder
I have said it before and I will say it again you cannot work harder or force progress to get more performance out of your strategy. If you try to work harder and force things you just fail more and dig yourself a deeper hole.
I know it sounds counter intuitive or even crazy to hear that too much market analysis can lead to over trading or analysis paralysis. But you would be surprised at how many traders struggle with this area in their trading. It is an inherent psychological trap that keeps many traders from ever reaching or achieving any real consistent success.
See humans have an innate need to feel in control of their life and of their surroundings, it is an evolutionary trait that has allowed our species to perpetuate its existence and ultimately arrive at our current modern-day level of civilization. Unfortunately for the aspiring market professional, this genetic trait of all human beings works against those trying to succeed at trading. In fact, most of our normal intuition of wanting to work harder or spend more time studying and researching for a project for work or school are instincts that are not beneficial to success in trading the markets.
Now there is absolutely nothing wrong with a little hard work, in fact in the real world I encourage it. But the issue with trying to apply the concept of hard work to trading is that beyond discipline, observation, patience and an ability to analysis and read charts, there really is no benefit to spending more time analyzing the same charts your already on top of or analyzing more economic news reports. At the end of the day we have no control over price movement and trying to further analyze economic data or trying to come up with an overly complicated method is essentially just a meaningless attempt to control something that simply cannot be controlled.
Thus, the main cause of trading failure begins with the traders psychological need to control their surroundings and when this emotional state meets the uncontrollable world of trading it almost always results in a loss of capital. To elaborate further this problem works to compound itself creating a ripple effect because once a trader loses a few trades he or she begins to get angry and starts revenge trading in an attempt to “get back” at the market. Once this process has begun it is very difficult to stop because it makes logical sense if things are not working out to put more time in and do more work to get better results. The difficult truth of the matter is that, after you have found a system that fits your trading style and you have reached a certain degree of technical and fundamental understanding, any further research or system “tweaking” beyond that point will only cripple you.
So how do we overcome this trading demon that has benefited us in the real world but has no place in our trading strategies. It is quite simple, if your trading edge is present then you execute your edge and do not involve yourself further in the process unless you have previously defined the action in your trading plan. In other words “Just set it and forget it”. When you decide to mess with or tweak your trade once you have already entered the market it almost always starts an emotional roller coaster that leads to moving your stop-loss further from your entry or getting rid of it entirely, moving your profit target further out, increasing your position size or over-trading. These actions almost always result in a loss of capital, because they were not objectively thought out, but were influenced by an emotional reaction that was caused by trying to control the uncontrollable.
Trading is more about timing than anything else. Timing is everything, you have to move to the markets rhythm. What that means is don’t fight the market take what it gives you when it decides to give it to you. Now how you react when the opportunity presents itself is paramount. Which brings us back to timing, are you entering the market at the right time, are you exiting your positions at the right time etc. Everything else in between are just extra thoughts and emotions that get in the way of your initial plan. Remember you cannot control the market but you can control yourself. In order to get more performance out of your strategy you must follow your trading plan. You must be rigid in your rules but flexible in your expectations.
Now onto the fun stuff. As you heard in my last newsletter Euro Swissy is about to get busy. If we look at the chart below it is apparent that we have a clearing bar from the Bulls after about 6 months of consolidation no that is not a typo yes 6 months of consolidation. This is such a big deal I have decided to shed light on this pair again. As traders it is our job to find out where the big money institutions are investing their money and follow suit. Since I have already established a long-term Bullish bias for you on this pair, this is a great opportunity to go to your time-frame find a good entry and stop-loss and “just set it and forget it”. If you follow the strategy in my last newsletter and execute properly you should be able to pull at least 700 pips from this position. Stay Tuned!

Look Out EUR/CHF is about to get busy!
Yes you heard it heard first EUR/CHF is about to get busy!
Gold & S&P 500 exploded for over 1,000 points+ like I predicted. Now EUR/CHF is my next CAMPAIGN, it is set for a monster move as well. After being sleep for over 23 weeks the GIANT has awoken.
Looking at the monthly chart below we can see a huge igniting candle that is the biggest move on the chart this candle shows us that the power has shifted from the bears to the bulls.

Now lets look at this weekly chart do you notice the bottoming signs. This pair has been quiet and off of our radar for quite some time. For 23 weeks the bears tried but could not break through the level of support at 1.20000. Then all of a sudden out of no where we get a huge candle from the bulls. I believe the bulls are trying to tell us something traders. As you can see we have an opportunity for an entry at 1.21162 with our stop-loss at 1.20740. A second option for your stop-loss would be to place it below the 1.20000 support level but you must account for your risk to reward if you opt for the second stop-loss option. Are first initial target (TP1) will be at the prior high we will then look to watch price action from there to see how it reacts to the prior high.

The Daily chart below has a nice Buy Setup forming now, after price action bounced off of a major level of support. We have an opportunity for an entry at 1.21120 with our stop-loss at 1.20740 and our initial target (TP1) at the prior high. If you look at the bottom of the chart you will notice the clearing bars that wiped out 23 weeks of consolidation to the left and ignited the larger move. Do you know how BIG it is to wipe out 23 weeks of price action with 2 candles (i.e. 2 weeks of price action) its BIGGER THAN BIG traders it’s colossal.

This pair should give us a nice opportunity to pull in some major pips as it has great upside potential. My only concern is the monthly 20MA, but it is not a big enough concern to shift my bias or deter me from the trade. Stay Tuned!!!
K.I.S.S. Keep It Super Simple
You enter a trade and then sit at your computer watching the market tick away. You find yourself scanning Forex Factory and other economic news outlets for the next few hours, unable to think about anything but what “could” happen to your trade. You can’t sleep at night because you are so addicted to trading the smaller time frames and to watching every price movement that all you can think about is the market. But despite your hard work and passion for the markets you cannot seem to find any consistent success. Does this sound familiar?
The reality is that most traders are not consistently successful. It only takes one trade to blow up your account or undo months of hard work. But just the same you only need 1 big winning trade a month to be a successful Forex trader.
How is that possible you might ask? Well, I’ll bet if you go look at your trading account history right now you might just find the answer yourself.
Have you ever thought to yourself I wish I did not take that trade or that was not in my trading plan. Along our journey to trading mastery we have all reached this point at some time in our trading careers.
You see, most of you are losing money because you are trading too often, and you are trading too often because you are fixated on over-analyzing the market, Forex news variables, and lower time frame charts (I consider any chart under the 1 hour to be “lower time frame”).
Sure, it’s possible to make money from sitting in front of your computer 8 hours a day staring at each tick (Watching the paint dry), but why in the world would you want to? Let’s face it, watching the market tick away is not really that fun, NOR is it productive…at all.
Shifting your focus to the daily charts requires mental fortitude and whole lot of patience, this takes intelligence and forward-thinking and a realistic attitude. Anyone can put on a winning trade and get lucky a few times, but how do you think it’s possible for some people to successful in the markets, to the point where they make a living from it? It’s because they have taken a longer-term view and they realize that their success is not defined by any one trade. So, if you want to turn your trading around, it’s time to swallow your need to “control” the market and for instant gratification, and begin taking a longer-term view of the markets by focusing on the daily chart time frame.
While the amount of money you risk per trade is a highly personal decision that depends on your individual portfolio, trading the higher time frames can allow you to risk a bit more per trade than trading the lower time frames. Take note: I am NOT insinuating that you should risk more per trade, I am saying that when you only TRADE 12 TIMES A MONTH (or thereabouts), you clearly can risk more money on one trade than if you are trading 40 times a month. So, this is an answer to the question “Reginald, I can’t make as much money trading the daily charts as I can on the lower time frames” taking fewer trades each month allows you to trade more lots per trade. However, keep in mind, this obviously only works if you can remain disciplined enough to not jump back into the market on revenge after you have a losing trade.
Daily charts reduce the frequency with which you trade – slow and steady wins the race
One thing I firmly believe in is that obtaining trading success is largely a result of the quality of the trades you take…not the quantity. By simply reducing the frequency with which you trade, you will simultaneously improve your odds of succeeding over the long-term. You need to understand and accept the fact that 15-20 quality trades a month is going to put you much further ahead than 50 or 60 emotion-fueled impulse trades a month…no matter how good it makes you feel to take them. Remember, the tortoise won the fabled race because he was slow and consistent, instead of fast and full of emotion like the hare…
A lot of traders are under the impression that it takes a lot of money to trade the daily charts.
I am often asked: “Reginald how can I trade the higher time frames when I have limited capital in my trading account, and the daily charts require wider stop losses. I can only afford to trade the 15 minute chart for now, then when I build up my account I will trade longer time frames”… If I had a nickel for every time I heard this, well I would have a lot of nickles lol!
Many traders think this way, and it’s usually just because they don’t know enough about position sizing in the FX market or because they think by trading bigger position sizes on the lower time frame charts they are going to somehow make money faster.
Let me set the record straight: Through position sizing, you can trade the daily charts just fine on a small trading account…you just have to trade a position size that correlates with your current portfolio. You need to get rid of the “get rich quick” attitude and out of the mind frame of thinking that trading a 15 minute chart is somehow going to provide you with more opportunities to profit.
Looking at the chart below we can see that we have had a very bullish run from the bulls this month which has brought price action back above the 20 MA and wiped out all of last months price action. By paying attention to the signs on the monthly time frame you are able to drop down a few time frames and find trading opportunities that are inline with the bias you have obtained from the monthly chart.

The higher time frames are at the heart of how I trade and obtain my bias; my price action trading strategies and my overall trading philosophy revolve around taking trades that are inline with the higher time frames. I know what I am looking for on the charts, if it shows up, I enter the trade, if not, I do not do a thing besides walk away from my computer. It is as simple as that.
I have not been able to write as much as I would like to as my new gig has kept me quite busy, but that is a good thing. Since I cannot trade my personal account while I am on the floor I have been forced to adapt a trading style to gel with my new schedule. Which means I have been forced to make my living on the higher time frames.
I have been gone for a while and I must say it is great to be back!
Up 2,500 points this month
The market is back in full swing and we have been rewarded handsomely. In the last 24 hours I have had some nice gains and I am on track to another good month.

Perseverance goes a long way in this business. I started out this month from behind after losing 4 trades in a row and digging myself into a small hole. I continued to execute my plan and manged to make back my losses and then some. I have also brought my batting average back to a respectable level.
The best way to pull yourself out of a losing streak is to have amnesia when you approach new positions. You got to forget about the last trade and how much you made or lost and move on to the next trade. Every trade is different and you do not want your emotions spilling over to the next trade. This allows you to stay focused and execute your plan based on what you see is happening instead of your emotions taking over and dictating what you do.
Risk to Reward
I have been so busy this week that I have not been able to trade my personal account much. But here is an update of where I am at as we approach the middle of the month.
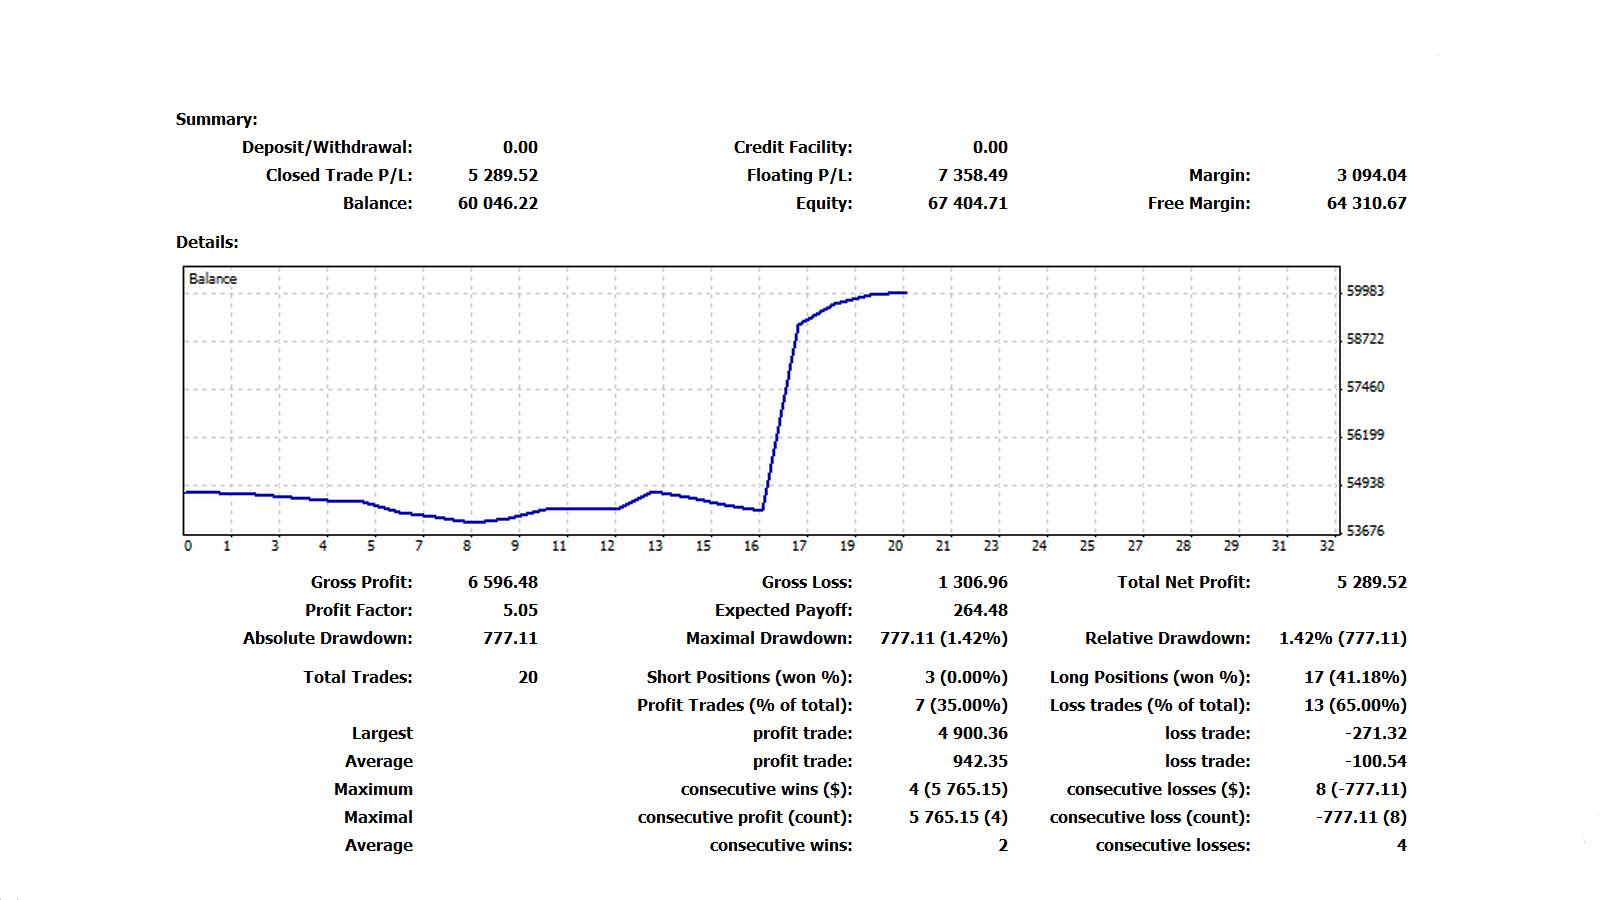
If you notice my batting average has suffered severely because I have not been able to pay as much attention to my positions. But because I maintained a solid risk to reward on each position I have still been able to see consistent results. Stay Tuned!
GBP/CAD Daily Buy Setup
Ok it looks like GBP/CAD wants to play ball traders. Remember to wait for confirmation and not to jump the gun. Our entry at this point is at 1.56807 with our stop-loss below the bottoming tail at 1.55602. Since we are looking to risk 121 pips you should be looking to take profit at the prior high for TP1, & to the 20 MA on the weekly for TP2. With our last lot we will allow the chart to take us out of the trade by trailing either bar by bar pivot by pivot or by trailing a moving average. It is up to you to determine which trailing technique is best suited for the circumstances. Now remember since you are getting in the trade a little late you have to ask yourself is the risk to reward inline with my trading plan. If yes take the trade, if not pass on the trade because there will always be other opportunities. Stay tuned!

XAU: Respect is Earned
OMG! it looks like gold just does not want to quit. Looking back at one of my previous newsletters we anticipated a pull back on the daily chart to find an opportunity to add to our position. The chart below is a snap shot of price action on August 22nd when we projected the pull back.

Look at that we got our pull back and follow through on our buy setup. Not only did we got follow through traders but we even got a new high. Now that is what I am talking about!!!

You are probably wondering how I was able to project that price would not only pull back but eventually present another buy opportunity. The move we got from the bulls last week took a lot of buying power to establish. Buying power that could only come from big institutions. When you see big candles or moves that clear a lot of price action on the chart they demand your attention and command respect. On the chart below you can see how I have highlighted the powerful moves established by the bulls in side the grey areas and the buy zones that have been established based on these moves by the bulls inside the blue rectangle areas. A Buy Zone is the area from the prior low of a bullish candle or bullish move to the prior high. We typically look for pull backs to the 33% – 61.8% level inside the Buy Zone. (The same applies in reverse for a sell zone created by a move from the bears.)

Now that we understand how to identify a Buy and Sell zone, your probably asking yourself how to incorporate these zones in your trading. It is easier than you think. First you must make sure that your Buy Zone is inline with your higher time frames. If it is counter to your higher time frames then you want to make sure that there is enough upside potential to your next area of resistance. In other words you want to make sure your risk to reward is on point. Now inside a Buy Zone you will see all kind of attempts from the bears to wipe out what the bulls have established. But it is your job not to be fooled by these moves, instead you want to be patient and wait for a buy opportunity to present itself inside the Buy Zone. This can be applied to any time frame but keep in mind that the higher time frames are always going to carry more weight than the smaller ones. So that means that Buy Zones on the higher time frames are always going to be stronger than zones created on smaller time frames. Now Rule number 2 is a Buy Zone is still valid until it is wiped out from the bears completely. If you follow these few rules and respect these Zones by trading with them your trading profits will soar.
GBP/USD Update: Discipline & Patience goes a long way
It is never over until it is over traders remember that. We have been rewarded for our discipline and patience as price has found it way back above the 8 ma and is now approaching our TP1. Traders always remember stick to your guns and follow your initial plan and you will be fine.

Bullish XAU: RingGOLD Hmm! I think my mother was on to something!!!

I am big trader of gold and a lot of other commodities mainly because of my political beliefs and knowledge on the banking system and the fiat currency that is used as a medium of exchange around the world. Another obvious reason is that it is apart of my family name. As I stated in previous Newsletters whenever I have an opportunity to go long Gold, Silver or Oil etc.. I hop on the opportunity as I believe long positions are inline with my long-term bias of gold reaching all time highs as it is a necessity in today’s society, and as central banks continue to print more and more money the result is higher gold prices in the long run. With all that being said it is obvious that price has been consolidating in an ascending triangle on our Daily gold chart. The weekly chart is very promising as we have had several bottoming tails that have formed since the beginning of May. Now we are officially above the weekly 20ma and our bias has shifted to the upside on the weekly chart. With the monthly inline with our long bias and coming off of a bottoming tail that bounced off of a rising 20ma last month. OMG look out Gold is set to explode to the upside. You heard it hear and from me and my fellow colleague Jonathan Velez first GOLD IS SET TO EXPLODE so strap on your seat belts and get ready for the ride. Stay Tuned!!!


S&P 500 Trade Update
It looks like we are starting to get some follow through on our weekly buy setup on S&P 500. So I have added to my long position at 1369.45. I expect to see price action rally to 1414.00 with little resistance if this weeks candle can maintain itself above the weekly 20MA. The monthly chart is is also looking promising as it is inline with our weekly chart which provides further confirmation that we could get follow through to the prior high. I have my first Take Profit Level at 1413.75, at that point I will then be watching price action to see if it can break through the prior high at the 1414 level. If price fails to break the prior high then I will adjust my exit strategy accordingly. Stay Tuned!!!

