Monthly Archives: September 2012
K.I.S.S. Keep It Super Simple
You enter a trade and then sit at your computer watching the market tick away. You find yourself scanning Forex Factory and other economic news outlets for the next few hours, unable to think about anything but what “could” happen to your trade. You can’t sleep at night because you are so addicted to trading the smaller time frames and to watching every price movement that all you can think about is the market. But despite your hard work and passion for the markets you cannot seem to find any consistent success. Does this sound familiar?
The reality is that most traders are not consistently successful. It only takes one trade to blow up your account or undo months of hard work. But just the same you only need 1 big winning trade a month to be a successful Forex trader.
How is that possible you might ask? Well, I’ll bet if you go look at your trading account history right now you might just find the answer yourself.
Have you ever thought to yourself I wish I did not take that trade or that was not in my trading plan. Along our journey to trading mastery we have all reached this point at some time in our trading careers.
You see, most of you are losing money because you are trading too often, and you are trading too often because you are fixated on over-analyzing the market, Forex news variables, and lower time frame charts (I consider any chart under the 1 hour to be “lower time frame”).
Sure, it’s possible to make money from sitting in front of your computer 8 hours a day staring at each tick (Watching the paint dry), but why in the world would you want to? Let’s face it, watching the market tick away is not really that fun, NOR is it productive…at all.
Shifting your focus to the daily charts requires mental fortitude and whole lot of patience, this takes intelligence and forward-thinking and a realistic attitude. Anyone can put on a winning trade and get lucky a few times, but how do you think it’s possible for some people to successful in the markets, to the point where they make a living from it? It’s because they have taken a longer-term view and they realize that their success is not defined by any one trade. So, if you want to turn your trading around, it’s time to swallow your need to “control” the market and for instant gratification, and begin taking a longer-term view of the markets by focusing on the daily chart time frame.
While the amount of money you risk per trade is a highly personal decision that depends on your individual portfolio, trading the higher time frames can allow you to risk a bit more per trade than trading the lower time frames. Take note: I am NOT insinuating that you should risk more per trade, I am saying that when you only TRADE 12 TIMES A MONTH (or thereabouts), you clearly can risk more money on one trade than if you are trading 40 times a month. So, this is an answer to the question “Reginald, I can’t make as much money trading the daily charts as I can on the lower time frames” taking fewer trades each month allows you to trade more lots per trade. However, keep in mind, this obviously only works if you can remain disciplined enough to not jump back into the market on revenge after you have a losing trade.
Daily charts reduce the frequency with which you trade – slow and steady wins the race
One thing I firmly believe in is that obtaining trading success is largely a result of the quality of the trades you take…not the quantity. By simply reducing the frequency with which you trade, you will simultaneously improve your odds of succeeding over the long-term. You need to understand and accept the fact that 15-20 quality trades a month is going to put you much further ahead than 50 or 60 emotion-fueled impulse trades a month…no matter how good it makes you feel to take them. Remember, the tortoise won the fabled race because he was slow and consistent, instead of fast and full of emotion like the hare…
A lot of traders are under the impression that it takes a lot of money to trade the daily charts.
I am often asked: “Reginald how can I trade the higher time frames when I have limited capital in my trading account, and the daily charts require wider stop losses. I can only afford to trade the 15 minute chart for now, then when I build up my account I will trade longer time frames”… If I had a nickel for every time I heard this, well I would have a lot of nickles lol!
Many traders think this way, and it’s usually just because they don’t know enough about position sizing in the FX market or because they think by trading bigger position sizes on the lower time frame charts they are going to somehow make money faster.
Let me set the record straight: Through position sizing, you can trade the daily charts just fine on a small trading account…you just have to trade a position size that correlates with your current portfolio. You need to get rid of the “get rich quick” attitude and out of the mind frame of thinking that trading a 15 minute chart is somehow going to provide you with more opportunities to profit.
Looking at the chart below we can see that we have had a very bullish run from the bulls this month which has brought price action back above the 20 MA and wiped out all of last months price action. By paying attention to the signs on the monthly time frame you are able to drop down a few time frames and find trading opportunities that are inline with the bias you have obtained from the monthly chart.

The higher time frames are at the heart of how I trade and obtain my bias; my price action trading strategies and my overall trading philosophy revolve around taking trades that are inline with the higher time frames. I know what I am looking for on the charts, if it shows up, I enter the trade, if not, I do not do a thing besides walk away from my computer. It is as simple as that.
I have not been able to write as much as I would like to as my new gig has kept me quite busy, but that is a good thing. Since I cannot trade my personal account while I am on the floor I have been forced to adapt a trading style to gel with my new schedule. Which means I have been forced to make my living on the higher time frames.
I have been gone for a while and I must say it is great to be back!
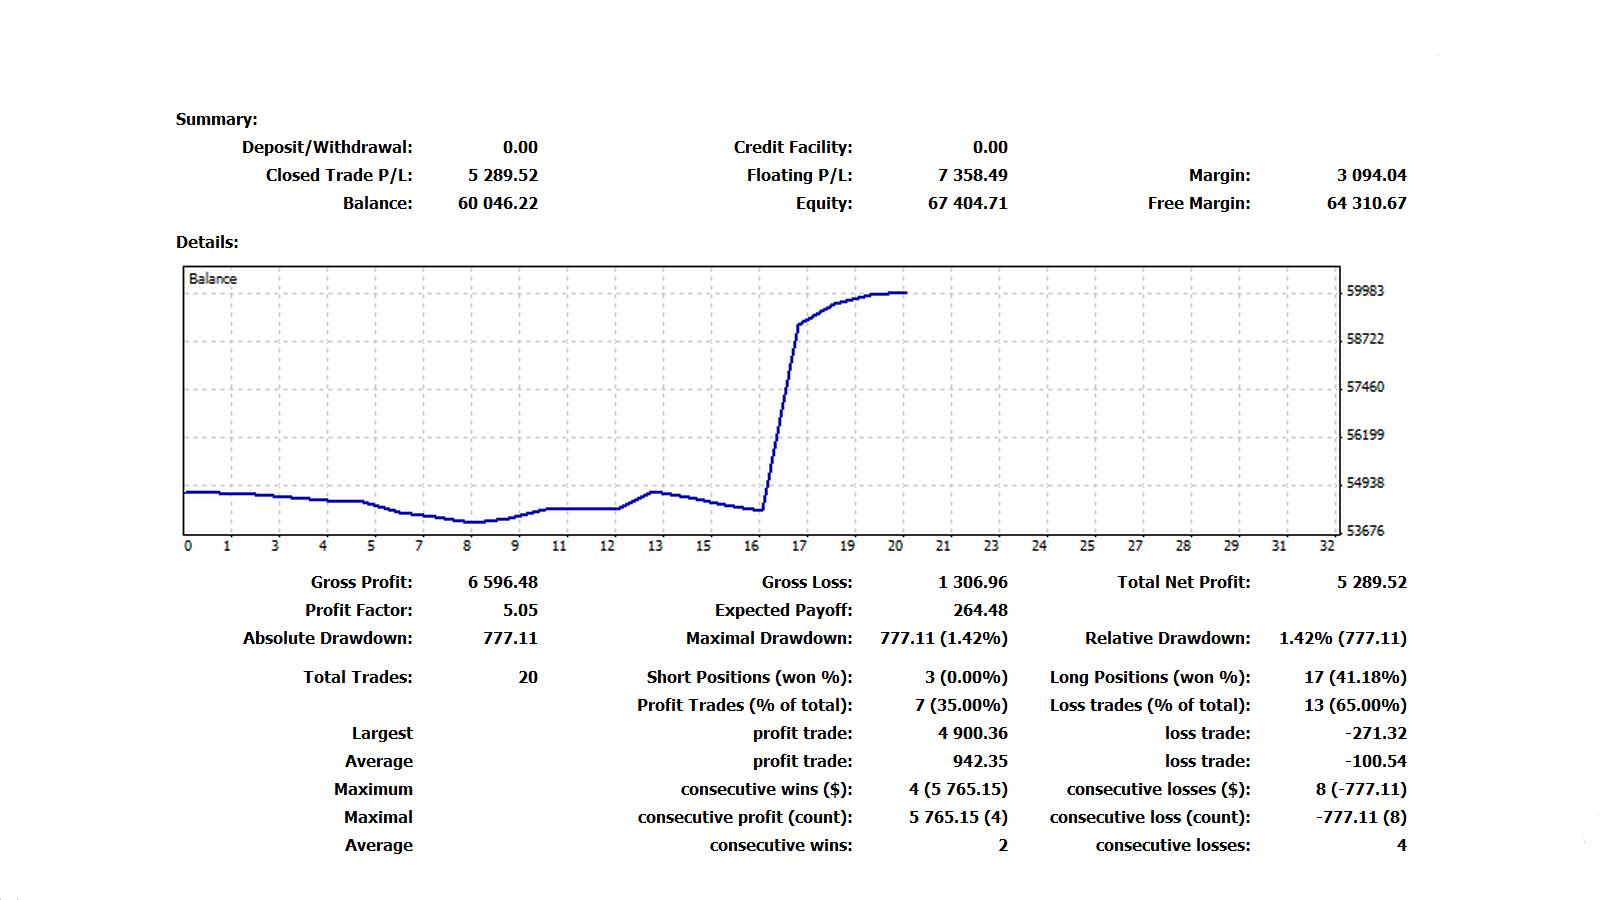
Up 2,500 points this month
The market is back in full swing and we have been rewarded handsomely. In the last 24 hours I have had some nice gains and I am on track to another good month.

Perseverance goes a long way in this business. I started out this month from behind after losing 4 trades in a row and digging myself into a small hole. I continued to execute my plan and manged to make back my losses and then some. I have also brought my batting average back to a respectable level.
The best way to pull yourself out of a losing streak is to have amnesia when you approach new positions. You got to forget about the last trade and how much you made or lost and move on to the next trade. Every trade is different and you do not want your emotions spilling over to the next trade. This allows you to stay focused and execute your plan based on what you see is happening instead of your emotions taking over and dictating what you do.
Risk to Reward
I have been so busy this week that I have not been able to trade my personal account much. But here is an update of where I am at as we approach the middle of the month.
If you notice my batting average has suffered severely because I have not been able to pay as much attention to my positions. But because I maintained a solid risk to reward on each position I have still been able to see consistent results. Stay Tuned!
GBP/CAD Trade Update
We have officially hit TP1 on our long GBP/CAD position. Our next target is at the 200MA on the daily chart Stay Tuned!

GBP/CAD Daily Buy Setup
Ok it looks like GBP/CAD wants to play ball traders. Remember to wait for confirmation and not to jump the gun. Our entry at this point is at 1.56807 with our stop-loss below the bottoming tail at 1.55602. Since we are looking to risk 121 pips you should be looking to take profit at the prior high for TP1, & to the 20 MA on the weekly for TP2. With our last lot we will allow the chart to take us out of the trade by trailing either bar by bar pivot by pivot or by trailing a moving average. It is up to you to determine which trailing technique is best suited for the circumstances. Now remember since you are getting in the trade a little late you have to ask yourself is the risk to reward inline with my trading plan. If yes take the trade, if not pass on the trade because there will always be other opportunities. Stay tuned!

